Industry Event

I went to the Deck The Halls light show at City Hall in Philadelphia. Although this wasn’t a super interactive event, I emailed the designer of the show in hopes that they will be willing to answer a few questions for me about projection mapping and his journey through learning it and creating his own company.

https://www.klip.tv/cityhallholiday017 – This is a link that shows previous shows for the Deck The Halls display created by the company Klip

https://www.ricardorivera.tv/about – This is the artist who founded the company Klip that I contacted

https://www.klip.tv/contact – Klips company

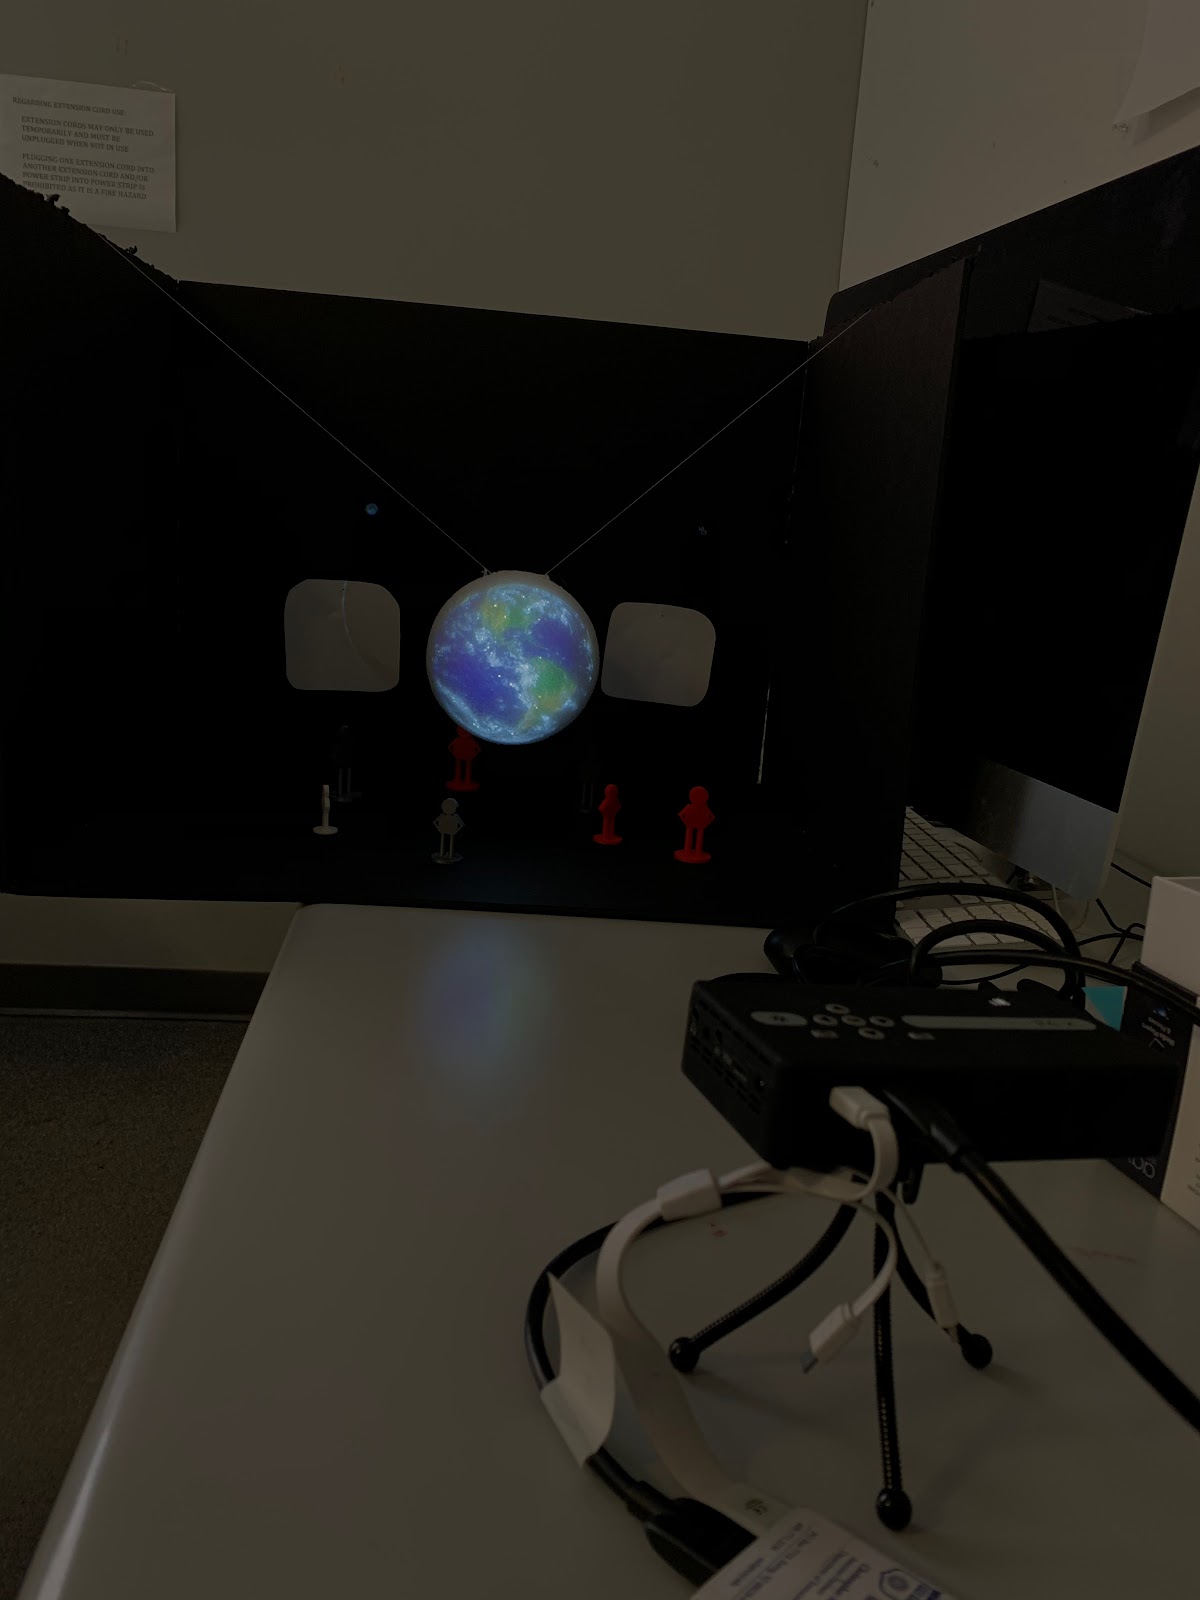
Watching this show was inspiring because I’ve never seen projection mapping like this before. It was really cool to see how the designers took into account every part of the building they wanted to highlight and the detail that was put into it so it made it effective and engaging to watch. This projection shows that it was made to only show on this building and would not have the same effect if it was displayed on another surface. I want my thesis project to have that the same effect because I decided to project my main show on a sphere instead of the wall or a flat object.

Prototype Feedback

Prototype 1

For my first prototype I thought mostly about what images I want to be shown on the sphere. I was deciding between animated and real graphics, and the best way to convey the story I am trying to tell. The feedback I received was that real graphics of the earth would convey more of a message than animations. I also was trying to figure out how I wanted to go through the story of the process of electronic waste and display it throughout the earth. A classmate suggested highlighting the country that I wanted to discuss next in a darkish grey color and zooming in on it as the shade got darker until the clip I wanted to show was played. The main outcome of this prototype feedback was that I needed to figure out what storyline I want to have in order to create the projection and how its going to make the sphere important to the show. 

Prototype 2

My second prototype was a mini model of what I imagined the room to look like. It was constructed out of cardboard and painted black with a white foam sphere hanging from a thin piece of cardboard that laid at the top of the box. The feedback that I received was to consider constructing a larger scale model of the room and using a small projector to look at how the light will act on the sphere. Also, I talked about what the sphere should be made out of and was debating if it should be something that’s already the shape of a sphere that I can find or building it myself. One idea was getting an inflatable beach ball so that its light and hollow, however the concern was that it would have to be spray painted white and the creases in the balloon could be distracting. Another idea was to create it from styrofoam like what the model ball was made out of, but the surface isn’t smooth and might alter the projections.   Classmates also suggested having some type of projection/screen display on the back wall behind the sphere for the audience to look at after the presentation. 

Prototype 3

My last prototype I built a larger scale model of the room and used a pico projector to display an image of an earth. While talking with my classmates there were several questions that I was asking/brought to my attention: 

  1. Will there be a start and finish? 
  2. Is the earth going to be projected on both sides? 
  3. How will the audience watch the video? 
  4. Video display on one half/black on the other side with statistics 
  5. Projectors? Screen displayers? A static visual that incorporates the screens?
  6. Where will the projectors be in relation to the sphere and screens
  7. What will the sphere be made out of 

The conversations during class struck a lot of questions and things to think about while I continue to do research and build on my idea. We discussed having a display in the back of the room that’s built and static and the two screens in the back would be connected to the display but have motion to them. Someone also mentioned the idea of only displaying the earth on half of the screen for the audience to watch when the show begins, and on the back half have other statistics that run while they can look at the display. I personally think that would be a better approach since I was still trying to figure out how I was going to project the earth on both sides of the globe and then realizing that either the audience will have to move or the globe will have to spin so they see the whole show. After this last discussion I felt more confident how I want the show to progress and my main focus now is continuing to do research and plan out/create what I want to be projected. Along with creating a design/logo for the print materials I want to have on the other sides of the room and what I want the title of the show to be called.

Prototype 1

For my first prototype I thought of possible ideas how I want the globe to look. I found this video of projection mapping on a globe that I’m hoping to create something similar to.

This video demonstrates the same concept of the first video with different types of visualizations. When I show the audience about the stress on the earth that electronic waste shows, I want my visuals to be similar to this as a video/more realistic picture.

Here are a few ideas of how the data could be shown on the globe at different times.

I’m hoping to see this globe at the Comcast center in Philly for my industry event. Even though it’s not an event itself, it includes projection mapping in a sphere shape that’s interactive.

Research Update 2

This week for my research I read about where electronic waste actually ends up, and how it gets there. One article I read called Where does America’s e-waste end up? GPS tracker tells all on PBS news hour discusses geolocating tracking devices that were stored in old computers, TVs and printers before sending them to donation centers.

An organization partnered with the Massachusetts Institute of Technology and put 200 geolocating tracking devices inside machines that were strategically sent to nationwide donation centers, recyclers, and electronic take-back programs which advertise themselves as “green”, “sustainable”, “earth friendly, and “environmentally responsible.” The data they collected showed that 1/3 of the electronics went overseas, even as far as 12,000 miles which included 6/14 trackers that were dropped off in Washington and Oregon. Other trackers ended in Mexico, Taiwan, China, Pakistan, Thailand, Dominican Republic, Canada, and Kenya. Most traveled across the Pacific to Hong Kong.

Puckett then traveled to Hong Kong where the GPS trackers say they are located, called the New Territories, an agricultural area along the border with mainland China. Along the way they passed several steam trucks carrying shipping containers from the port. When he got closer to the destination they heard power drills and shattering glass coming from the other side of a high metal wall made from old shipping containers. The journalist that Puckett teamed up with knocked on the gate and said hey wanted to fill a shipping container with printers to refurbish and sell in Pakistan, and the worker opened the door.

Behind the door workers were dismantling LCD Tvs. The ground that they were standing on is filled with broken white tubes. The fluorescent lamps were made to light up flat screens, however when they break they release invisible mercury vapor into the air. A minuscule amount of mercury can be a neurotoxin.

Workers had no idea of the risk that they’re in by being around these toxic chemicals. New Territories used to only be a pass-through for smuggled e-waste, but the Chinese government cracked down on whole electronic imports so now they’re doing the processing there.

Prototype Plan

Prototype 1: For the first Prototype I’m going to sketch/design how I want the globe to represent data that I’m presenting. I’ll either have several designs based on the different areas it’s going to cover, or one detailed plan on one of the sections.

Prototype 2: The second Prototype I’ll have ideas on if I want to project imagery onto the walls as well as the globe and how I would want them to interact with each other. This would be sketches/designs of other projection mapping not on the wall.

Prototype 3: The third Prototype will be a little hard to demonstrate, but I want to create a visualization of the layout of the room. Where the globe will be placed, the other objects in the room, and the path I want my audience to take.

Research Update 1

For the first part of my research I looked for articles based on electronic waste. I want to focus my project more towards the contributions technology has to recycling and the damaging effects to the planet. The article I found The Global Cost of Electronic Waste published by The Atlantic in 2016 discusses Apple products and the continuous replacing of perfectly good devices we do. Apple sells millions of new iPhones when the new generation is released, replacing perfectly good recent models. This is because everyone wants the “new” fad. After having an iPhone for a year or two, it could possibly show signs of wear such as glass may be cracked, the home button could stick, etc. However, few people choose to repair their phones over getting an upgrade. Not only phones are being thrown out at slight inconvenience, tablets, laptops, music players, etc are being wasted and thrown away because of laziness or a lust for the future. Throwing away thousands of electronic devices has several effects on the ecosystem. First, it increases mini and procurement for the materials that are needed to produce the devices. It also produces large quantities of electronic waste which could be reduced through resale, reuse, or repair. The quantity and speed of discarded electronics has increased quickly over the years, being far from when households would keep their tv’s for more than a year. “As per the report of ENDS Europe agency, built-in obsolescence increased the proportions of all units sold to replace defective appliances from 3.5 percent in 2004 to 8.3 percent in 2012. The share of large household appliances that had to be replaced within the first five years grew from 7 percent of total replacements in 2004 to 13 percent in 2013. According to a 2014 Gallup poll, 89 percent of young adults (18 to 29) own smartphones; 41 percent of the older generation owned VCRs at the same age.” 

By having this increase in need for devices, it has made the manufacturing inexpensive and repairing them more difficult. Companies also have increasingly ended support for older models of phones with old operating systems. WhatsApp and Facebook announced they will stop providing support for apps on certain models of Blackberry. Not only does this have to do with portable electronic devices, printer manufacturers realized they can make more money selling ink and toner than the printer itself. “According to a Financial Times report, a gallon of ink for the typical printer costs the consumer around $8,000. But the prices of printers are so low that once their initial ink supply is spent, the consumer is tempted to buy a whole new machine” The concept of steering customers to buy new items by reducing their lifespan of products is nothing new. In 1924, Phoebus made sure that lightbulbs did not exceed their expected life span of 1,000 hours. 

Electronic waste raises concern about air pollution, water pollution, soil pollution, information security, and human exploitation. When scavengers burn electronic waste to get the copper, air can be polluted, and if it’s not disposed properly toxins from electronic waste can enter soil and water supplies. 

https://www.theatlantic.com/technology/archive/2016/09/the-global-cost-of-electronic-waste/502019/

Final Concept

Overtime, the significance of taking care of our planet for ourselves and the generations after us has become more and more important to me. I’ve realized a lot about the damage we’re creating by living on Earth and the impact it has on us and the other species that live on this planet. I value the life I have and the planet we live on, and my goal for this project is to demonstrate the importance of taking care of it. With this project I want to communicate to my audience and connect with them on a deeper level. This project can relate to every single person in one way or another, and I hope to bring out that realization through projection mapping. Though this doesn’t reflect my future aspirations, it’s important to me and will hopefully make a difference to a few peoples everyday lives. The interest in my project should be high because this issue effects everyone whether they know it or not. Even if some people believe that nothing can happen during their life time, they have to recognize their future children or family members will be impacted by the way we leave it.

My project will be different that existing projects because it will be an interactive exhibit. Instead of reading about the causes and effects of recycling, you’ll be able to view it on a sphere shaped object that will represent the globe. You’ll also be able to feel the heat from a heat lamp that demonstrates the heating of the Earth, and see produced trash on the ground.

I envision an open room with a giant sphere (around 7ft x 7ft) hanging from the ceiling with trash on the floor underneath it in a circular shape, and a heat lamp in one of the corners. I want the earth to be projected on the sphere with statistics and data visuals interchanging. On one wall, I want to possibly have time lapses going for different representations of land that now has piles of waste on it. On the other two sides I want to have options 1 and 2 for which direction we can go with if we chose to recycle or not. On the last wall I want to represent how this is effecting our animals and wildlife on Earth, and how it can affect the future of our families and generations.

Research Plan

Books/Articles:

Websites:

People:
Brian Potter
Lauren Madden
John Kuiphoff

Resources:

  • Lightform or MadMapper
  • Online Tutorial courses
  • Animation course

Field:

Environmental Sustainability

Revised Concept – Globe Projection Mapping

Initial Concept: I want to create a space using a physical built globe and projection mapping to show causes with the issues revolving recycling on the earth. I imagine using a showroom downstairs with the globe in the center of the room hanging from the ceiling, trash and garbage underneath it and around the area of the globe, heat lamps in certain areas of the room, and overall a dark atmosphere. On one wall there will be statistics, and on the other two walls there will be option A) if we continue to recycle and take care of the earth, and B) if we don’t take care of it what the planet will turn into. On the globe I want to project the earth and the amount of recycling in each continent possibly using visual graphs built into the globe along with projection mapping. 

Program: Lightform

Similar projects:

  • https://vimeo.com/41586724

Layout of room:

  • globe hanging from the top center of the room
  • trash around the bottom of the globe on the floor
  • heat lamp in the top right corner of the room
  • projection mapping on each wall and on globe
  • wall 1: option 1 for the future – clean healthy planet
  • wall 2: option 2 for the future – destroyed world filled with trash
  • globe will be interactive being able to move the globe

Timeline:

October – December: Research lightform, learn the program, learn animation

December – January: Design layout of projections

Feb – March: Build globe/in room items

April: *hopefully* start testing project /get feedback

October – May: Figure out what I want displayed, research topic, get statistics, etc

Initial Concepts

Concept one: Projection mapping. I want to create a space using a physical built globe and projection mapping to show causes with the issues revolving recycling on the earth. I imagine using a showroom downstairs with the globe in the center of the room hanging from the ceiling, trash and garbage underneath it and around the area of the globe, heat lamps in certain areas of the room, and overall a dark atmosphere. On one wall there will be statistics, and on the other two walls there will be option A) if we continue to recycle and take care of the earth, and B) if we don’t take care of it what the planet will turn into. On the globe I want to project the earth and the amount of recycling in each continent possibly using visual graphs built into the globe along with projection mapping. 

Concept two: Clothing try on! Using mirrors and projection mapping to allow users to try on clothes, shoes, accessories, etc. They will have options of different clothing articles to decide between and they’ll be able to stand in a mirror where the projector will be in front of them and project the clothing items onto them. They’ll either have to be dressed or put on a one colored full body cover so the clothing projects correctly? 

Concept three: Hologram shopping!!! While you’re online shopping, you can have an option to show a holographic image of the product you’re looking at. This way you can get a better idea of the size, shape and usage of the product.